I’m on cardiology right now, and yesterday the fellow taught us some basics for interpreting EKGs. The trick is the have a thorough algorithm and do it every time so you don’t miss anything.
Disclaimer: Obviously this is just a cursory intro so folks won’t look like complete fools like me- who, when asked to interpret an EKG, went into a cold sweat and said, “Well, it looks like the heart is beating.” Attendings do NOT like that.
INTRO
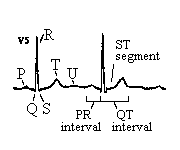
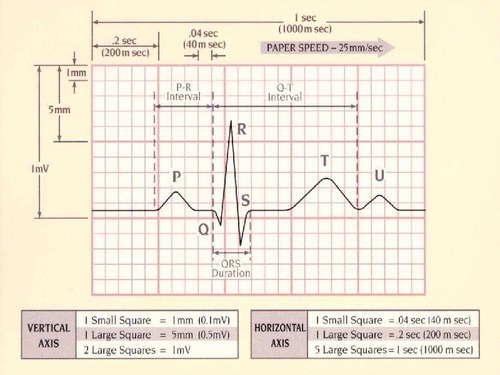
This is what a normal lead II EKG one beat reading should look like. TAKE NOTE LITERALLY EVERYONE STOP CALLING YOUR SQUIGGLY LINES HEARTBEATS IT IS WRONG GAAAHHHH.
Normal EKG.
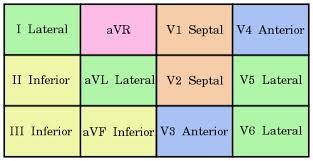
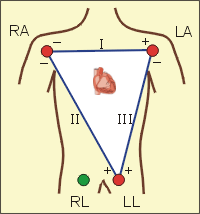
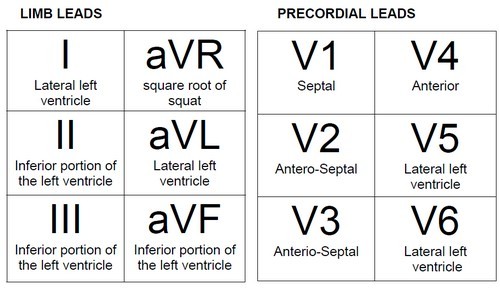
What the various leads are monitoring.
1. Rhythm: Sinus or not- aka, is the SA node talking to the AV node correctly?
Check in leads V1 and II- if there is a P wave before every QRS you have sinus rhythm. If this is not the case, you do not have sinus rhythm! A whole discussion on things messing up sinus rhythm will come when I have a better grip on it myself.
2. Rate: How fast is the heart beating- aka, how fast are the ventricles depolarizing?
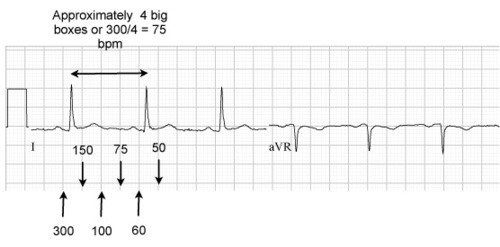
So EKGs are little tiny boxes in bigger boxes, right? There are several methods for calculating rate using the boxes, but the one that works for my brain is to count the big boxes between R’s and divide that by 300.
So, 1 big box between R = 300/1 = 300 bpm.
2 big boxes between R= 300/2= 150 bpm. And so on.
In general, any heart rate above 100 is tachycardia, and any heart rate below 60 isbradycardia. These values may vary (ex: SIRS criteria counts heart rate above 90 as tachy). Normal heart rate is around 75 (exceptions include athletes- look up athletic heart syndrome)
3. QRS Complex: Wide or narrow- aka, is the Bundle of His bossing the ventricles around?
Basically, a nice narrow QRS complex generally indicates the bundle of His is intact and operating how it is supposed to. A wide QRS complex indicates something is awry with the Bundle of His- could be an organic pathology, could be a medication side effect (ex: antiarrythmics, TCAs, quinidine, to name a few), could be an electrolyte imbalance (ex: hyperkalemia), could be other things.
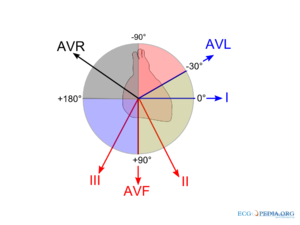
4. Axis: Is the heart depolarizing the way it should- aka right shoulder to left nipple.
I, personally, am still sorting out the axis system, and it’s hard to do in this format. The first, most basic place to start is checking if lead I and aVF are POSITIVE, meaning their QRS complexes go ABOVE the isoelectric line. If that is the case, you are probably ok axis-wise.
Essentially, lead I’s vector goes from left to right, and aVF’s vector goes from head to toe. So the average of those vectors is the general path of depolarization of the heart. You want the axis to be between -30 and +90.
So, if aVF is positive, but lead I is negative (the QRS is below the isoelectric line) that means it is going from left to right instead and would be classified as a right shift. Likewise, if lead I is positive, but aVF is negative, that means it is going down to up and would be classified as a left shift.
There is soooo much more to axis interpretation, this is just a starting point.
5. Intervals: Again with the conduction system, it’s, like, totally important that it obeys all the rules every time.
PR= <.2 seconds, or one big box
QRS= <.12 seconds, or 3 small boxes
QT= < ½ the RR interval
6. ST segment changes: checking for CAD- aka, is the myocardium getting enough blood/oxygen?
Since the folks in the South seem to consider butter a food group and know that if it can’t be fried it’s not worth eating, CAD is a huuuuuuuuge issue here. When blood supply to the myocardium is compromised, there will usually be characteristic EKG changes. Note- not every episode of angina/MI will have EKG changes though!
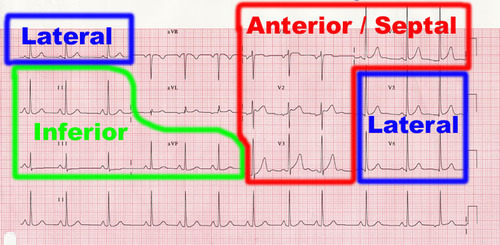
– Inferior leads —> right coronary artery.
– lateral leads —> circumflex artery
– anteroseptal leads —> left anterior descending.
Disclaimer: does not apply to everyone all the time, some folks have variant coronary anatomy.
So the EKG changes to look for must be seen in two contiguous leads, aka, two inferior leads or two lateral leads.
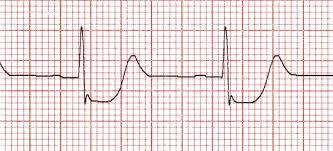
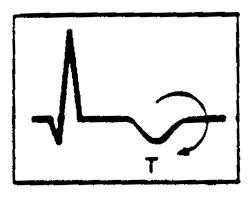
– Ischemia (low oxygen) = ST depression or T wave inversion (EXCEPT T wave inversions are ok in leads V1 and aVR)
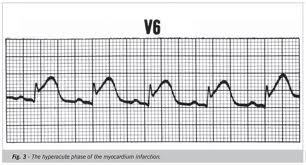
– Injury = ST elevation
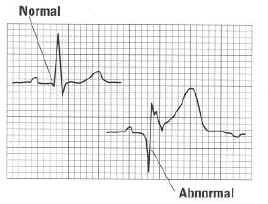
– Old infarct/dead myocardium = pathologic Q waves. Basically that first negative vector (aka, the Q of the QRS complex) should never be bigger than one tiny box.
source http://mynotes4usmle.tumblr.com/
